Auction price intelligence
One week from PRD to production.
A private tool that turns a messy car-auction source into pricing a buyer can trust - what a lot is worth, and what actually moves the number.
Open the live demo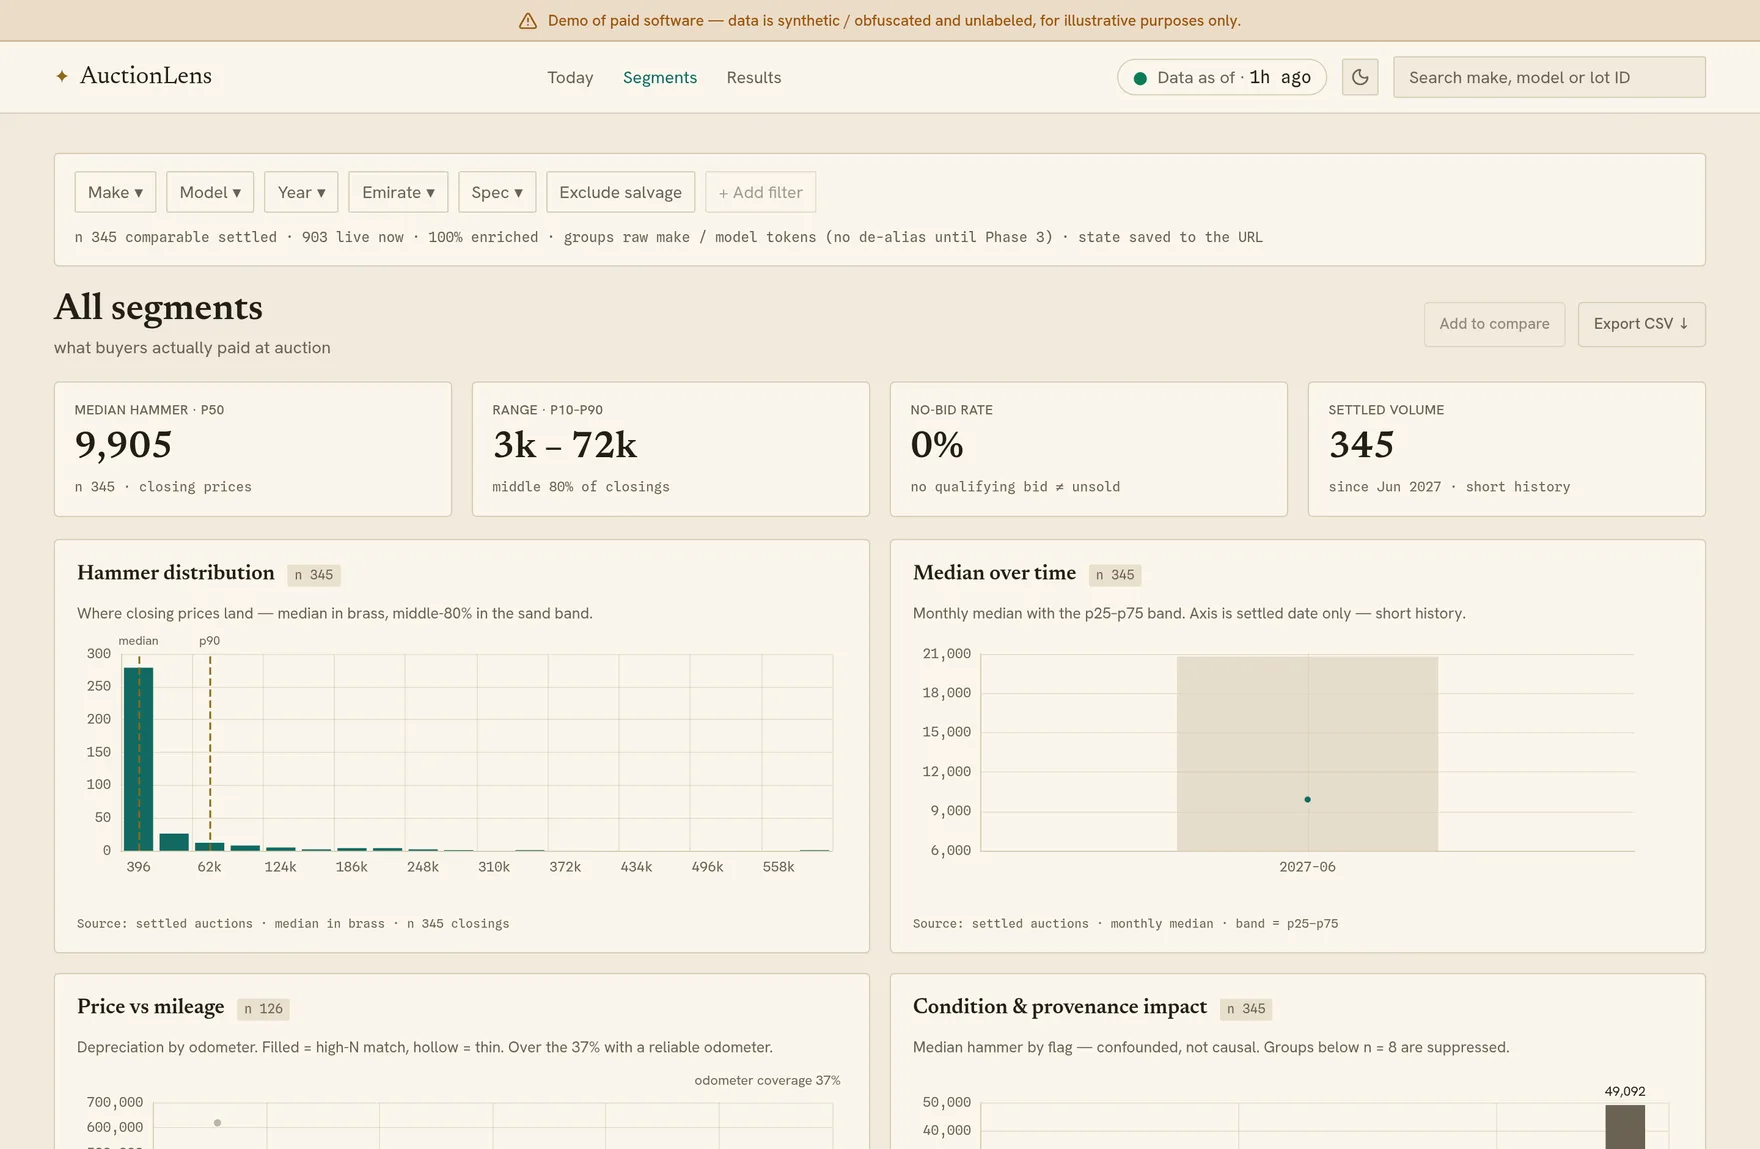
- Client
- Private (name withheld)
- Industry
- Car auctions
- Services
- Data platforms & integrations, Web app development, Cloud & DevOps
- Role
- Product engineering partner
- Timeline
- ~1 week to production
- Year
- 2026
- Platform
- Web
The outcome
The challenge
Three feeds, none of them agreed
The source wasn't one tidy API. It was three separate feeds - the lot list, the per-car detail, and the live bid and settlement state - each shaped differently and each changing on its own clock.
Messy data, real money on the line
Odometers half-filled, salvage and insurance-write-off status buried in free text, the same model spelled five ways. A number that looks confident but is wrong costs a buyer at the hammer.
Private, and wanted soon
The client wanted their own tool rather than a seat in someone else's SaaS - and they wanted to watch it come together, not wait months for a big reveal.
Our approach
- 01
Store the raw truth first
Every sweep lands as a timestamped snapshot before anything is cleaned. The tidy, typed view is derived from that - so when a rule needs fixing we rebuild it, instead of re-scraping hammer prices we can never get back.
- 02
One small handler per feed
Each feed gets its own bit of code that reads it, scrubs anything personal, and normalises it. Adding another marketplace later is one new handler - not a rewrite of the whole thing.
- 03
Ship in slices, watch it the whole time
Dashboards, alerts, and traces went in early, so the pipeline was observable before it was finished. The client saw working pieces land every few days instead of waiting for a reveal.
What we built
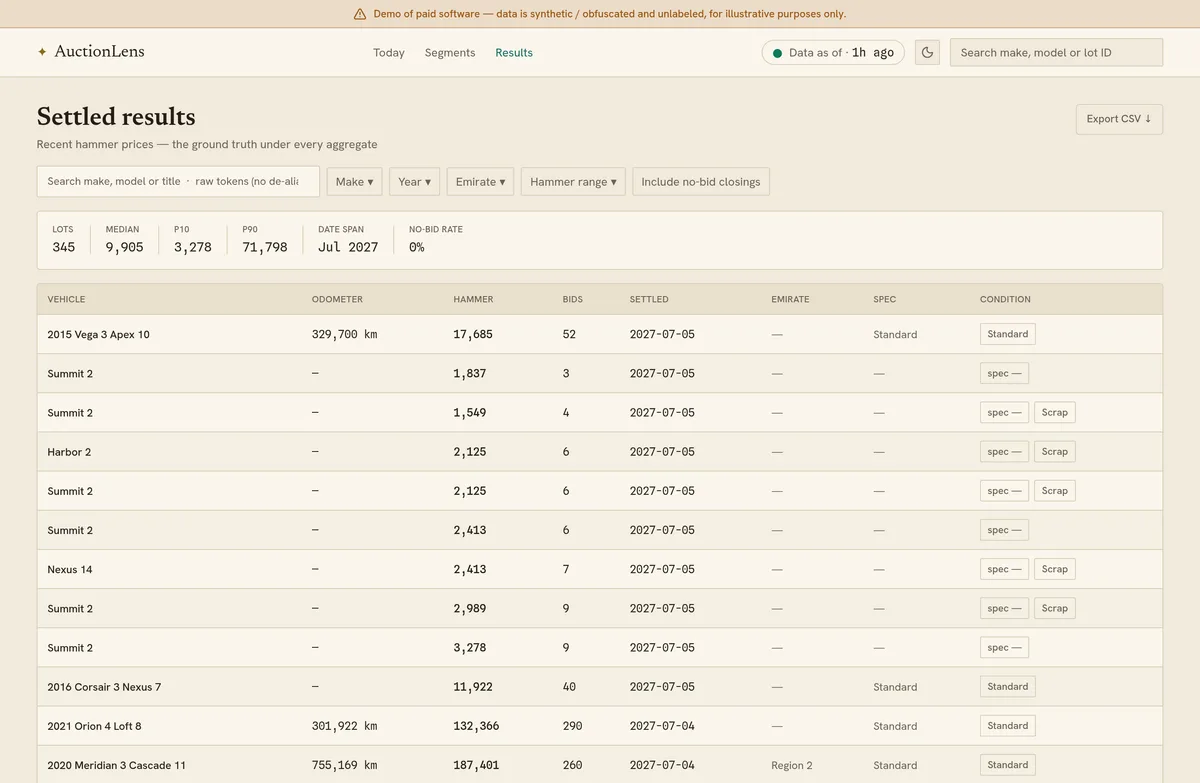
The screens here are the public demo - AuctionLens - running on synthetic, obfuscated data. The real product is private to the client, so the numbers, names, and dates are scrambled; the tool underneath is exactly what shipped.
It watches a car-auction source and turns it into something a buyer can act on: what a given lot is likely worth, and what’s pushing that number up or down.
The plumbing
The ingestion is deliberately boring, in the way good infrastructure should be. A scheduler sweeps the source on a cron and writes every change as a raw JSON snapshot - the untouched source of truth. A second worker projects those snapshots into one clean row per lot: make, model, year, mileage, market spec, and a set of condition flags pulled out of messy free text - salvage, scrap, insurance-cancelled, ex-taxi, and the rest. Both workers coordinate through the database itself, so a redeploy or a second instance can’t quietly double-run and corrupt the record.
Because the clean view is derived, not scraped, we can change how we read the data and rebuild it from the raw snapshots - without ever going back to the source for prices we can’t recover.
The part the client cares about
Ask about a specific car and the tool walks a comparable-sales ladder - exact match, then year ±1, then ±2, then make and model - and stops at the first tier with enough real closings behind it. It hands back a median, a sensible range, and a ceiling to bid to. If there honestly isn’t enough data, it says so, rather than inventing a number.
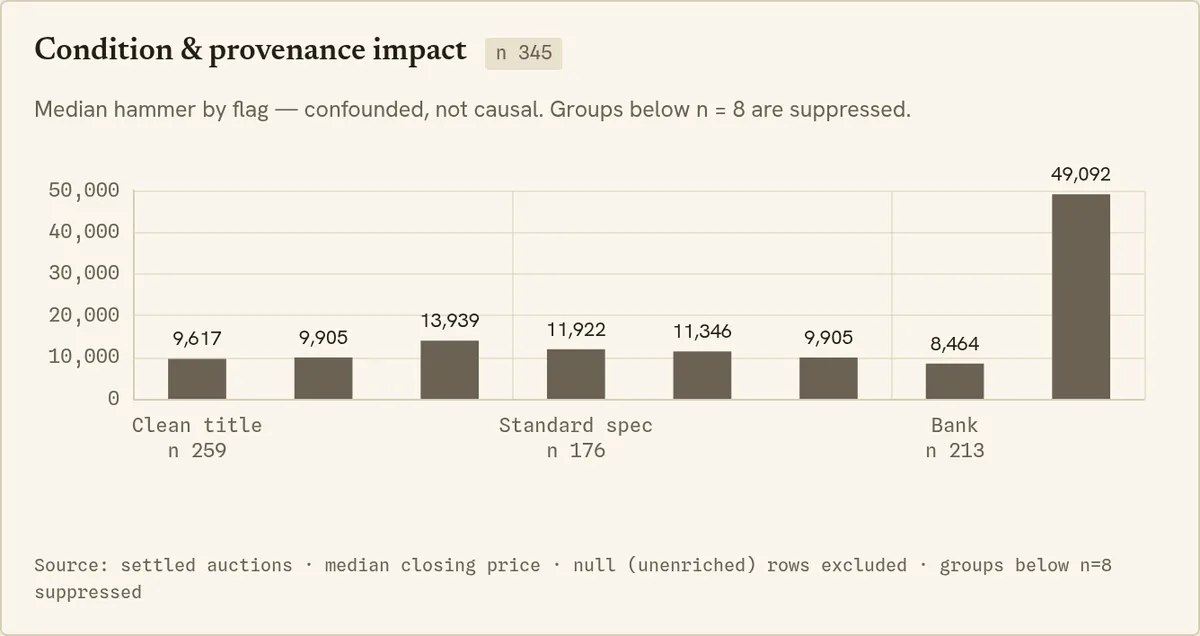
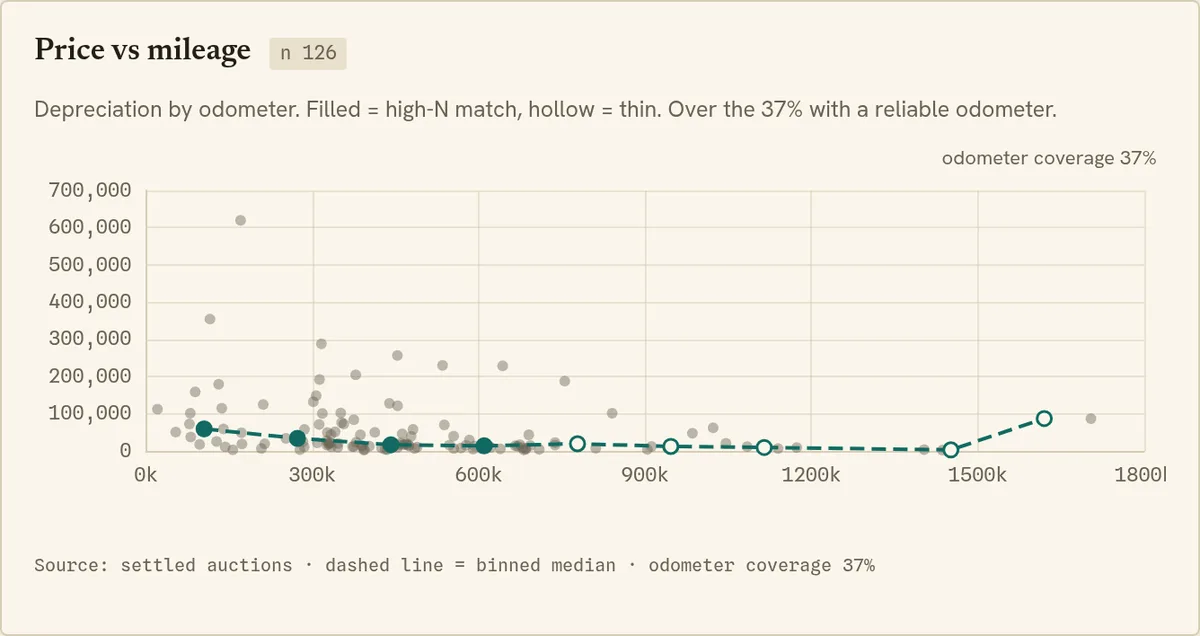
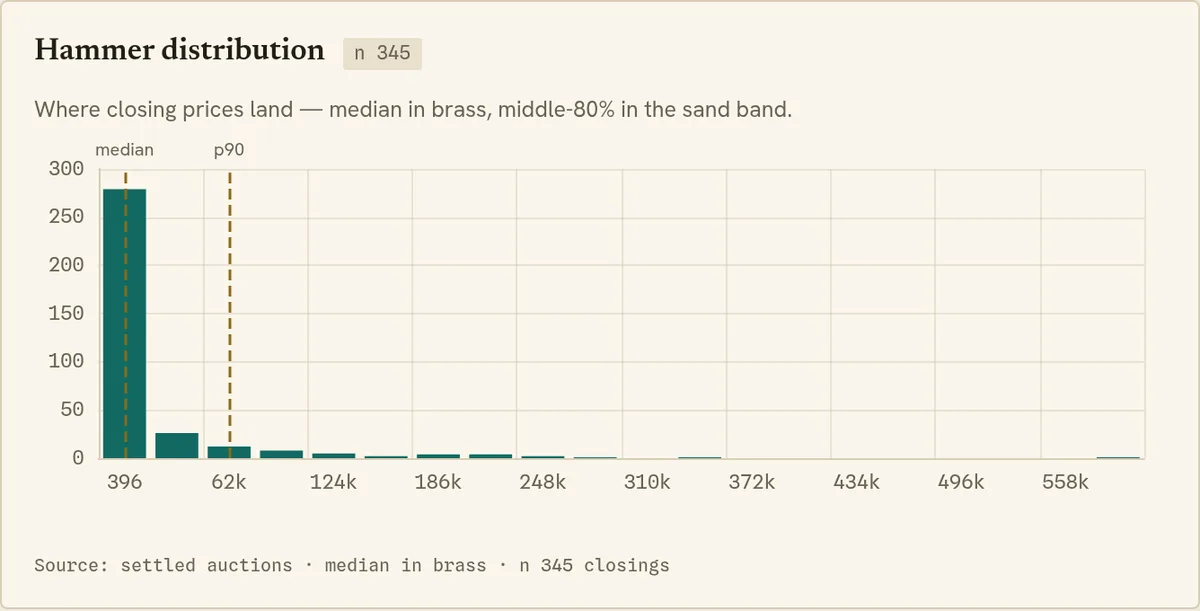
The segment view answers the bigger question: what does this kind of car go for, and what moves the price? Distribution of closings, median over time, price against mileage, and median hammer split by condition and provenance. Every figure carries its sample size and suppresses itself below a confidence threshold. That restraint is the whole point - a tool people trust because it won’t bluff.
We watch it, so nobody has to guess
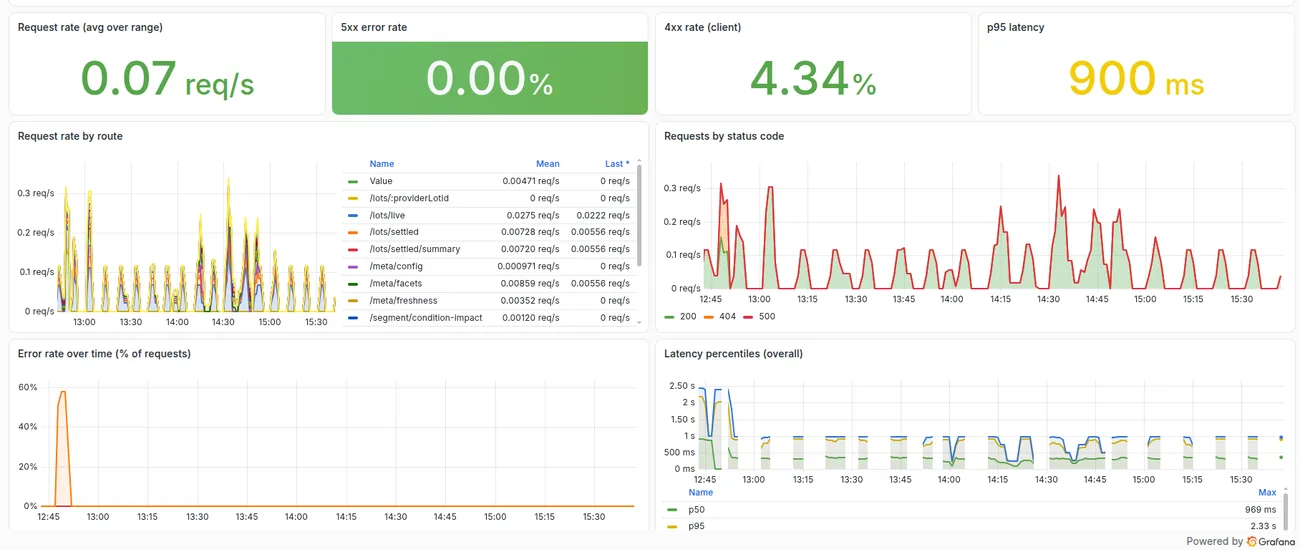
Monitoring went in on day two, not bolted on later. The services stream traces, metrics, and logs into Grafana Cloud over OpenTelemetry, and a few focused dashboards answer the questions that matter when something feels off.
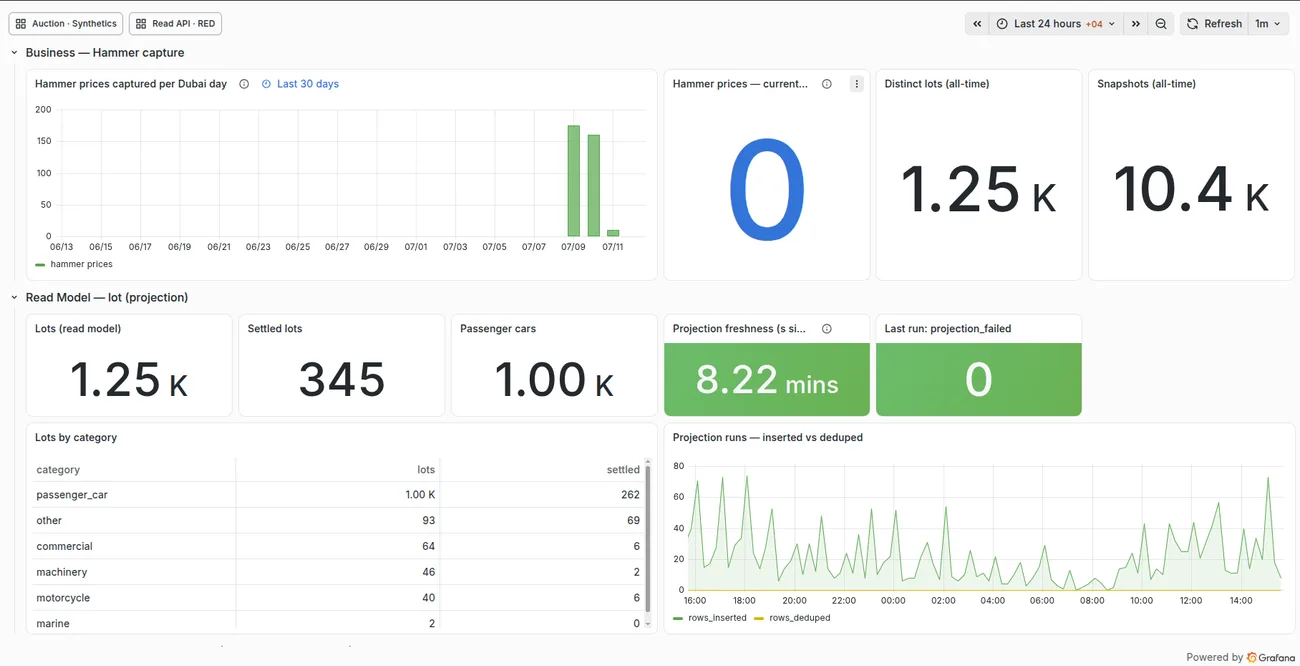
The load-bearing one is a dead-man’s switch - how long since the last clean sweep of the source. If it goes quiet for more than twenty minutes an alert fires; a stalled collector is invisible until you go looking, and by then you’ve lost data you can’t get back. Around it sit error and partial runs, whether the read-model projection is keeping up, and hammer prices captured per day - that last one builds through the evening as lots close, so a quiet morning is normal, not an incident.
The read API is measured RED-style - request rate, error rate, and p95 latency - so a slow endpoint or a run of 5xxs shows up before anyone notices. Outbound calls to the auction source get the same treatment; a third-party API that quietly gets slower is exactly what you want to see coming.
And since the point is availability, a synthetic check hits the app from the outside on a schedule and records real uptime - “a request actually worked,” not just “the server says it’s up.”
Every panel earns its place. It’s what lets a small, senior team run this in production without hovering over it.
Fast, and still running
We shipped the first production slice within a week of the PRD, with monitoring live from day two, and it has been collecting and serving data ever since. The ML valuation model - trained on the growing dataset - is the funded next phase. It drops in behind the same interface the statistics already use, so the swap is a change in confidence, not a rebuild.
Built with
Frontend
Backend
Cloud & DevOps
Observability
A closer look
“Honestly, what I didn't expect was how much I'd enjoy the process. Every few days there was something new that actually worked and that I could use, not just a status update. They kept it fast but didn't let quality slide, and when I changed my mind on something it turned around quickly. We went from an idea to running in production in about a week.”
Have a similar project in mind?
Tell us what you're building - we'll come back within one business day.
Start a project